GBPJPY - breakout and retest
2019-11-29 23:06:13
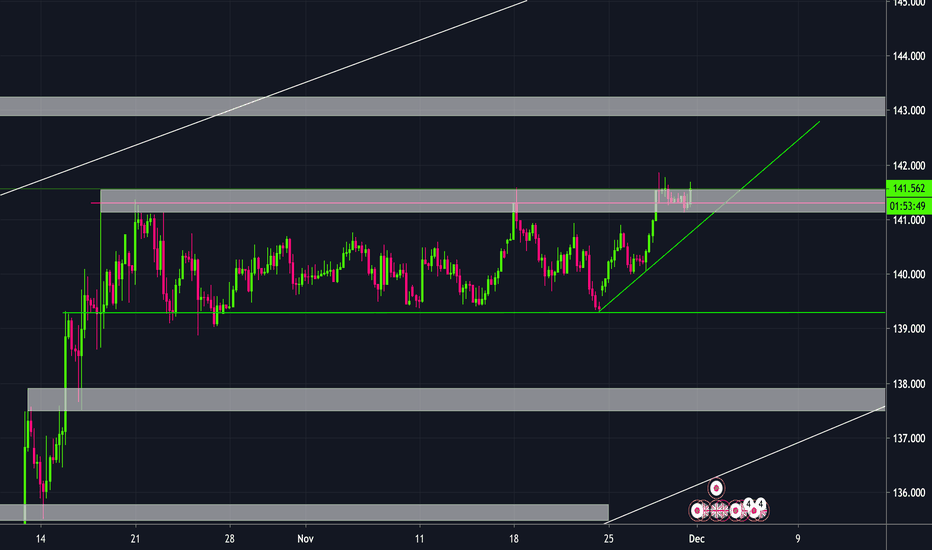
4 hour chart shown breakout and retest complete. It could be false since it been stuck with range for long weeks. Now this is where we can see previous resistance become to new support level. Possible new target to reach the next resistance level. Again, this could be false because you will want to look at the bigger time frame and able to see channel trend which it is very wide.
Thumb if you agree